
These graphs represent the FY 2020 Case-Mix Adjusted Finalized Rates for the Payment Driven Payment Model.
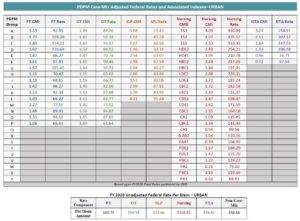
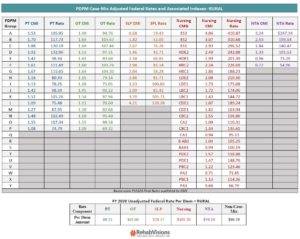
Click HERE to access a copy of Chart containing both the Urban and Rural FY 2020 Finalized Rates.
Rates taken from the Final Rule for PPS and Consolidated Billing for SNFs, FY 2020, published 7/30/19